|
Employment Estimates (1) |
||
|
of WNMU Graduates as of 20012 |
||
|
Year of Graduation |
Number of Graduates |
Employed in New Mexico |
|
2006 |
408 |
78% |
|
2007 |
350 |
77% |
|
2008 |
409 |
77% |
|
2009 |
376 |
75% |
|
2010 |
372 |
69% |
|
2011 |
424 |
69% |
Note: this data is provided for informational purposes only
And does not constitute or imply a warranty of employability
upon graduation.
(1) Estimates are employment within one year of graduation based on data provided by the New Mexico Higher Education Department and the New Mexico Department of Workforce Solutions. The un-employment insurance contributions data provides an indication of employment, but certain occupations and employers are excluded from this reporting requirement as are self employed individuals. Graduates employed out of state are not accounted for in this table. In short, these estimates are conservative.
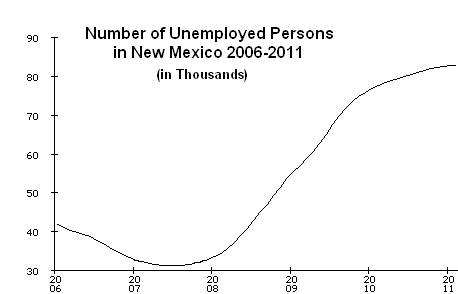
As shown below, by 2010 New Mexico joined the rest of the nation in a deep recession.
Despite grim economic times, WNMU graduates continued to have relatively high success rates finding employment after completion.